Tech Systems Embedded |
Table of
|
Eclipse TutorialThis tutorial describes the use of the Open-Source Software Text Editor and IDE (Integrated Development Environment) EclipseThe version of Eclipse used in the tutorial is Juno Build id: 20120614-1722.The tutorial is based on using the Atmel AT91SAM3U-EK evaluation board which contains the Atmel AT91SAM3U4 uP.The tutorial sets up Open-Source GCC as the compiler. Links to the tools used can be found here.
Using Eclipse & Associated Tools
T. Hawkins TABLE OF CONTENTS
2.2. Install the Yagarto Compiler Tool chain 2.3. Install the Yagarto Make utility 2.4. Install the J-Link GDB Server 3.2. Install Zylin Embedded CDT 4.1. Set Up J-Link GDB Server as an Eclipse External Tool (SAM-ICE) 4.2. Set SAM-BA as an Eclipse External Tool 4.3. Adding Tools to the "Favorites" List 5. Creating a Make Project in Eclipse 5.2. Import the Files into the Project 5.3. Set the Build Directory for the Project 5.5. Set the Output Directory for the Project 6.1. Setting Up Header File Include Locations 7.2. Search for Function or Variable Declaration 7.3. Search for Test in a File, Project, or Workspace 7.4. Search for References in a File, Project, or Workspace 8. Using the Debugger in Eclipse 8.1. Create a Debug Launch Configuration for the Project 8.2. Adding Launch Configuration to the "Favorites" List 8.3. Open the Eclipse Debug Perspective 8.4. Start the J-Link GDB Server 8.5. Start the Eclipse Debugger 9.1. Appendix A: James Lynch J-Link GDB Server Command Description for the AT91SAM7S 9.2. Appendix B: Atmel Doc6310 J-Link GDB Server Command Description 9.3. Appendix C: Include Library Locations for Yagarto 9.4. Appendix D: Symbol Definitions for the AT91SAM3U-EK MakeFile 9.5. Appendix E: Yagarto modifications for the AT91SAM3U-EK MakeFile
|
|
|
1. OverviewThis document describes the use of Eclipse Juno Build id: 20120614-1722. The tutorial is based on the Atmel AT91SAM3U-EK evaluation board which contains the Atmel AT91SAM3U4 uP.
2. Installing External Tools
2.1. Confirm Java
Eclipse Juno needs Java 6 jre or later. The Java version can be checked in a command window using the command:
Java -version
Install the latest version of Java if necessary.
2.2. Install the Yagarto Compiler Tool chain
The Windows tool chain and Make utility can be downloaded at:
Double click the tool chain install file to install:
yagarto-bu-2.22_gcc-4.7.1-c-c++_nl-1.20.0_gdb-7.4.1_eabi_20120616.exe
Windows 7 and later do not like the default directory locations. Choose something like the following location (after making the GNU_Tools directory):
C:\GNU_Tools\yagarto
2.3. Install the Yagarto Make utility
Double click the install file, and use the same directory as used for the tool chain location:
yagarto-tools-20100703-setup.exe
2.4. Install the J-Link GDB Server
The Windows J-Link GDB Server can be downloaded at:
https://www.segger.com/download_jlink.html
Double click the install file, and use the default directory locations:
Setup_JLinkARM_V452.exe
To set up the USB drivers, go to: C:\Program Files\SEGGER\JLinkARM_V452\USBDriver, and run:
JLinkCDCInstaller_V1.2b.exe
2.5. Install SAM-BA
SAM-BA can be downloaded at:
https://www.microchip.com/en-us/development-tool/SAM-BA-In-system-Programmer
Note: Do not use sam-ba_2.12; it has a bug. Use sam-ba_2.11.
Double click the tools file, and use the default directory locations:
sam-ba_2.11.exe
3. Installing Eclipse3.1. Install Eclipse
Eclipse can be downloaded at:
https://www.eclipse.org/downloads/
Eclipse can be downloaded as a zip file that contains eclipse such as:
eclipse-cpp-juno-win32.zip
To install, just take the "eclipse" folder inside the zip file and put it in a location on the C:\ drive such as in "Program Files." You must use a zip extractor such as WinRAR; the native Windows zip utility will not completely extract the files. Create a shortcut from eclipse.exe in the eclipse folder, and place it on the desktop.
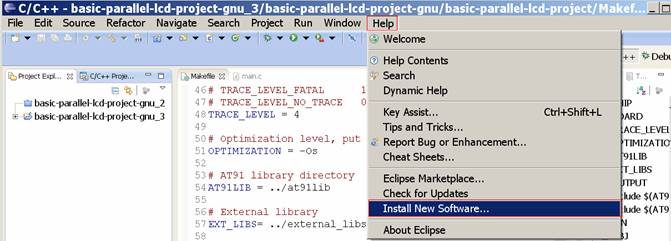
3.2. Install Zylin Embedded CDT
With Eclipse running, choose Help>Install New Software...
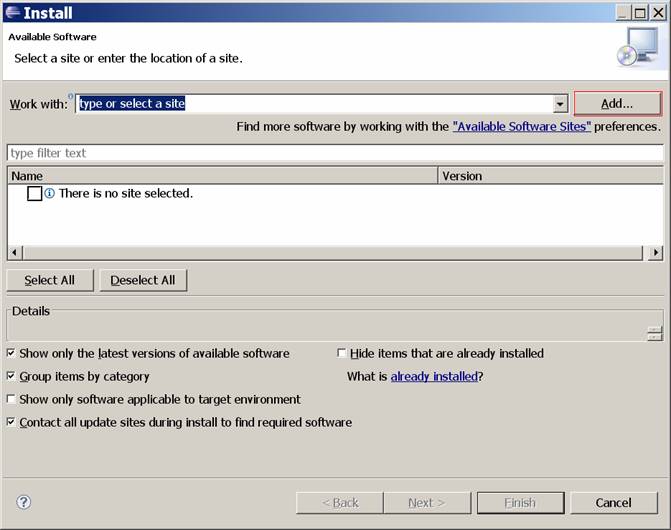
In the "Install" Dialog box, choose "Add."
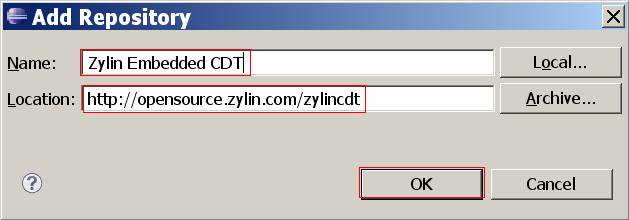
In the "Add Repository" Dialog Box, Input the following, and choose "OK:"
Name: Zylin Embedded CDT Location: http://opensource.zylin.com/zylincdt
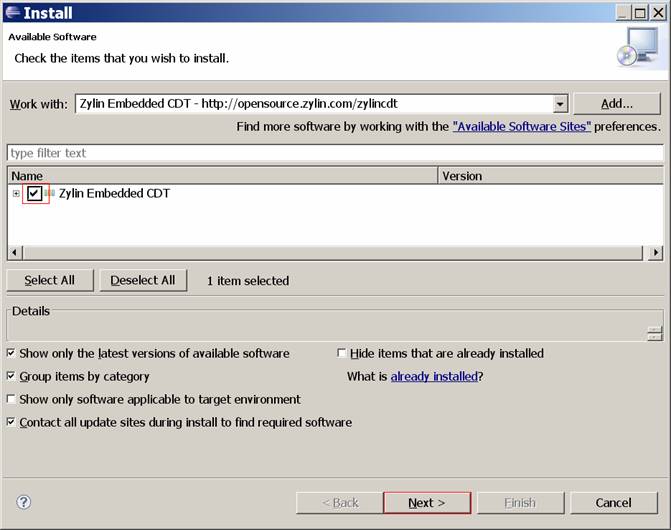
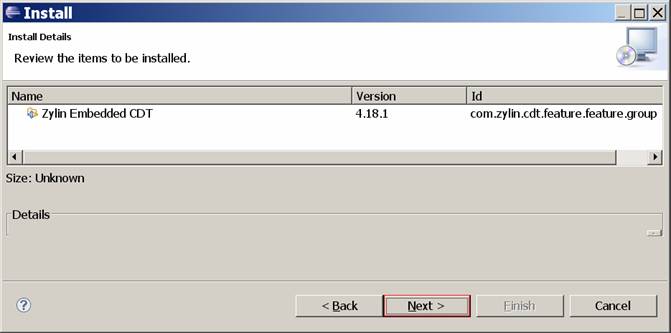
In the following "Install" dialog box, check "Zylin Embedded CDT" and choose "Next."
In the following "Install" dialog box, choose "Next."
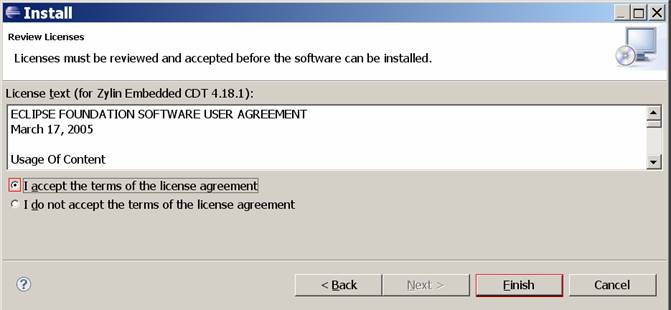
In the following "Install" dialog box, choose "Finish."
4. Setting Up External Tools4.1. Set Up J-Link GDB Server as an Eclipse External Tool (SAM-ICE)
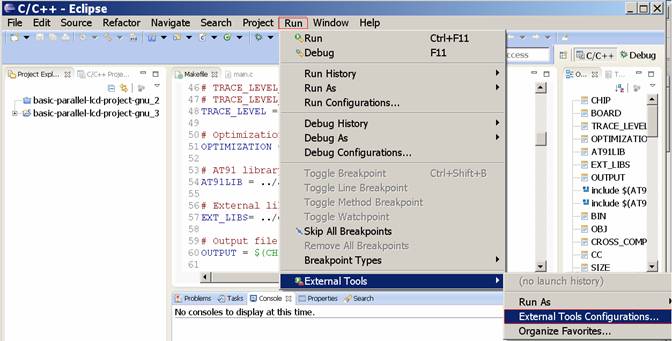
Choose "Run>External Tools>External Tools Configurations..."
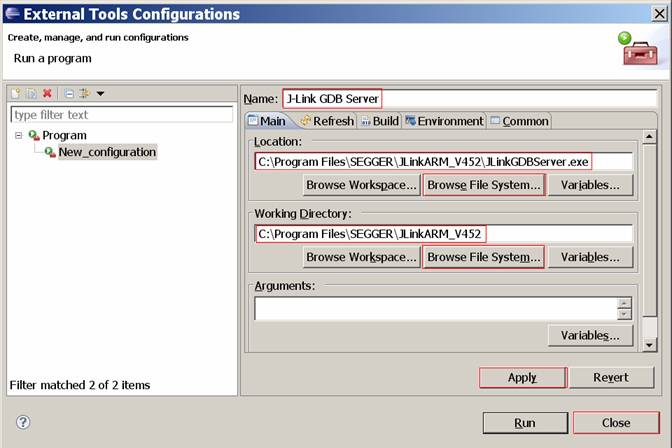
Highlight "Program" and choose the "New Configuration" tool icon.
Enter the follow information, then choose "Apply." then "Close":
Name: J-Link GDB Server Location: C:\Program Files\SEGGER\JLinkARM_V452\JLinkGDBServer.exe Working Directory: C:\Program Files\SEGGER\JLinkARM_V452
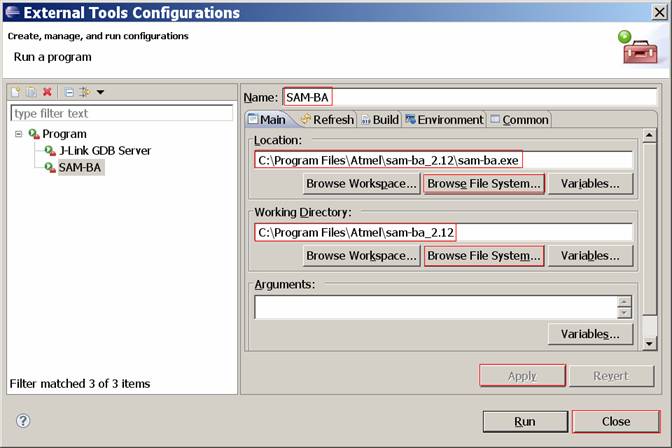
4.2. Set SAM-BA as an Eclipse External ToolChoose "Run>External Tools>External Tools Configurations..." Highlight "Program" and choose the "New Configuration" tool icon. Enter the follow information, then choose "Apply." then "Close":
Name: SAM-BA Location: C:\Program Files\Atmel\sam-ba_2.11\sam-ba.exe Working Directory: C:\Program Files\Atmel\sam-ba_2.11
Note: Do not use sam-ba_2.12; it has a bug. Use sam-ba_2.11.
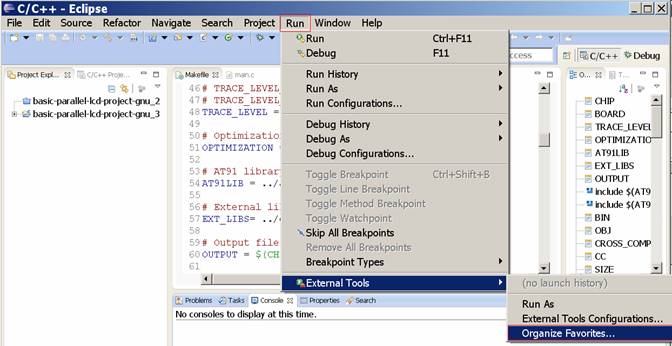
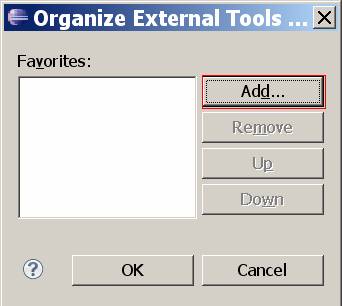
4.3. Adding Tools to the "Favorites" ListChoose "Run>External Tools>Organize Favorites..."
Choose "Add."
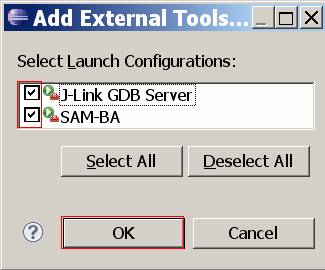
Select the Tools, then "OK," then "OK" again:
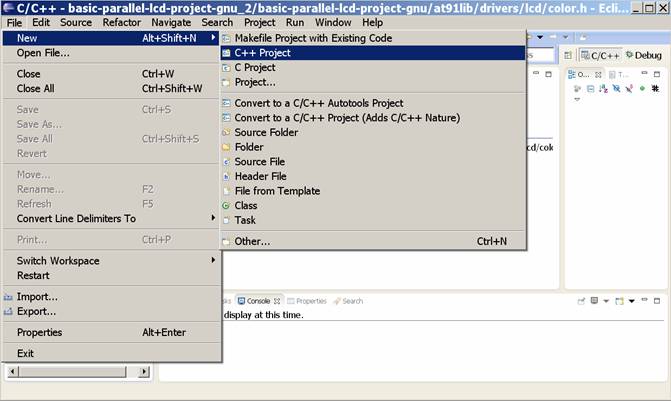
5. Creating a Make Project in Eclipse5.1. Create the ProjectChoose "New>C++ Project."
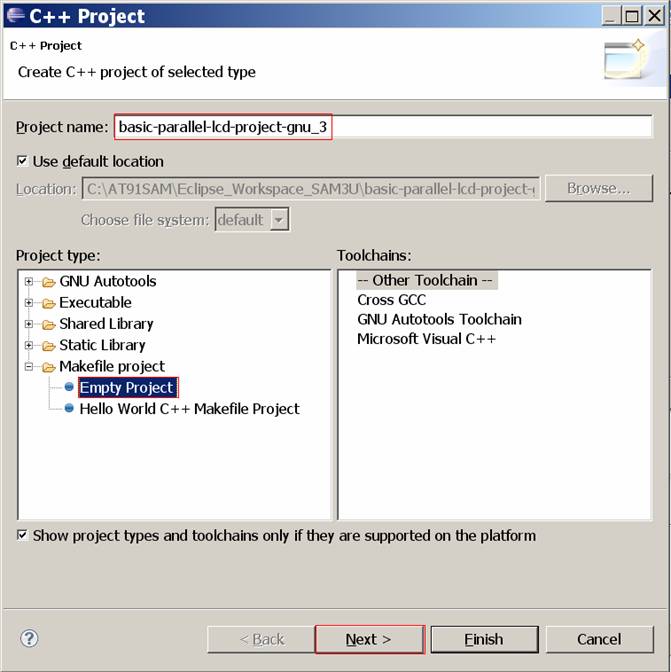
Enter a Name and choose "Empty Project," then "Next."
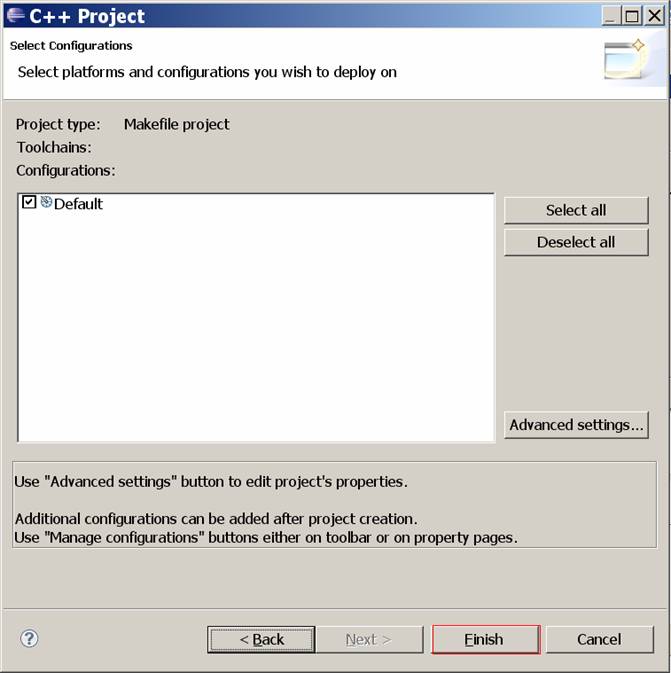
Choose "Finish."
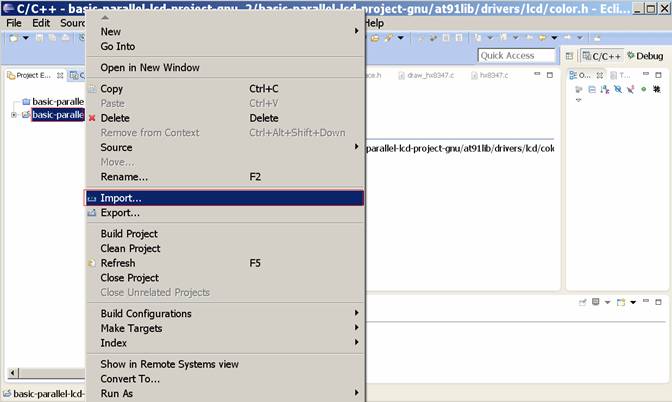
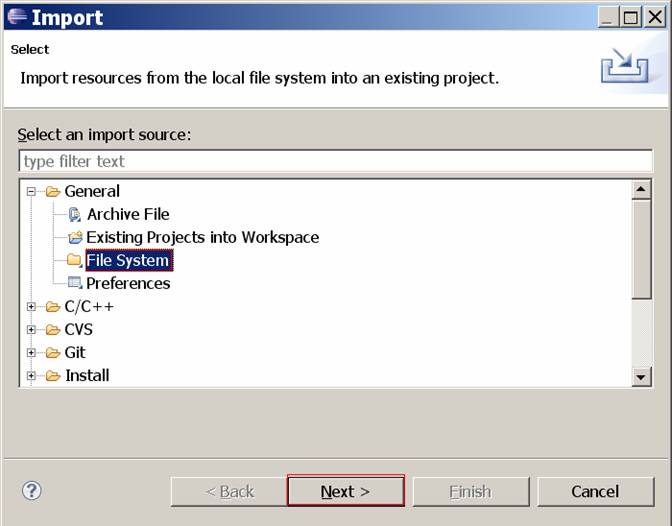
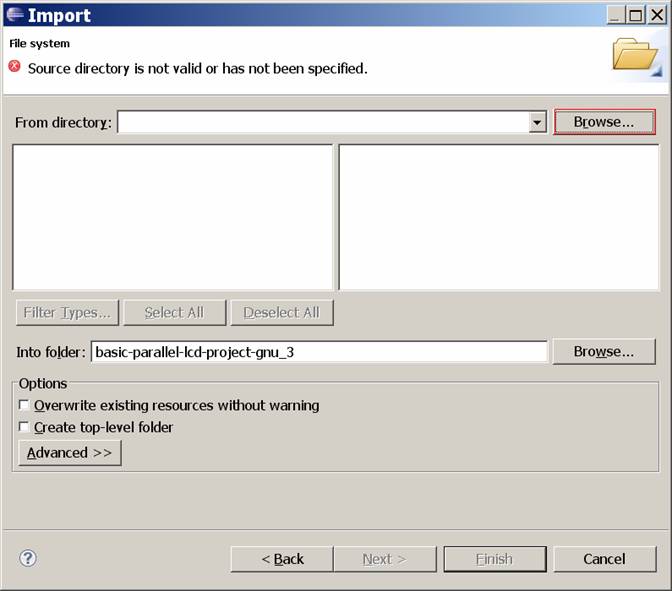
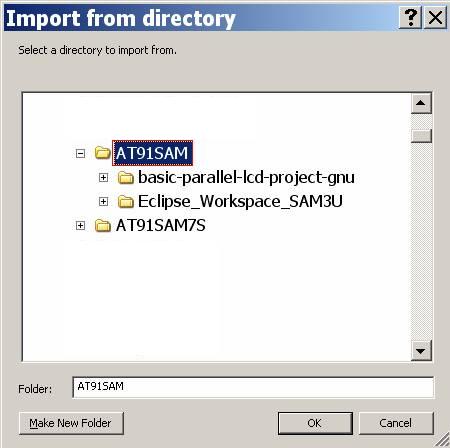
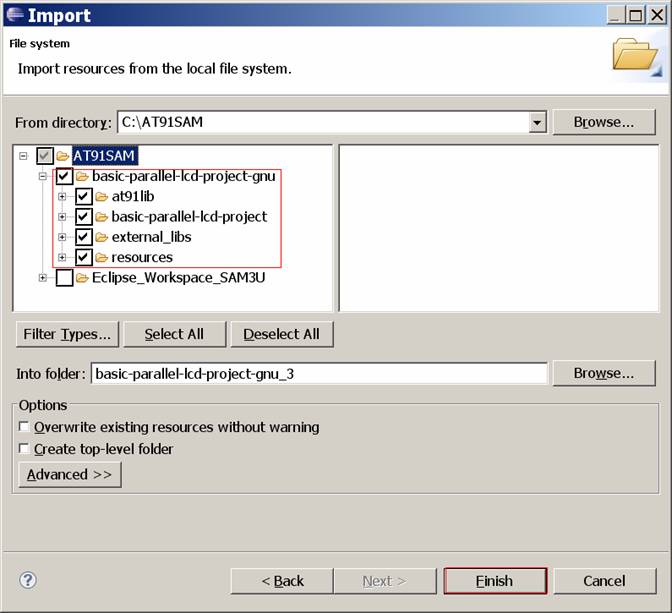
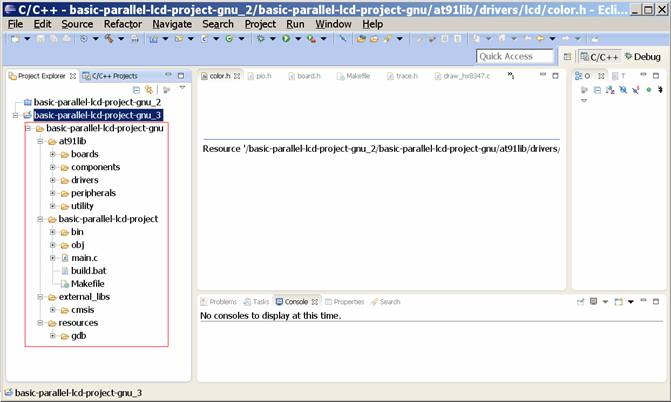
5.2. Import the Files into the ProjectRight-Click menu on the highlighted project in the left pane and choose Import...:
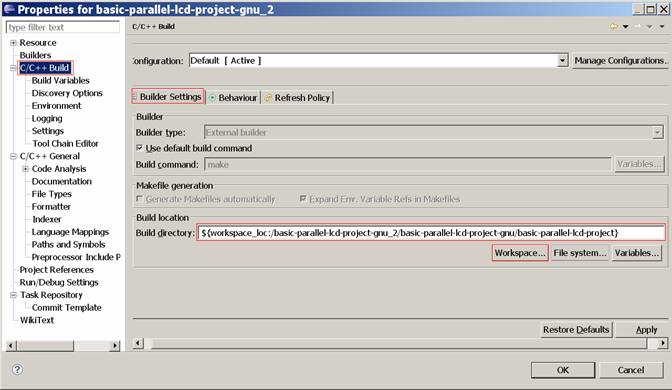
5.3. Set the Build Directory for the ProjectThe default Build Directory is the Project Root. If the makefile is located elsewhere, such as in a subfolder, then go to
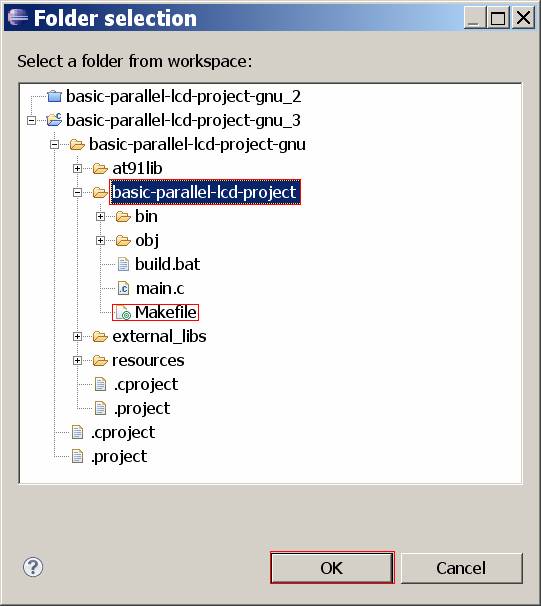
Navigate to the MakeFile directory and select it, then choose "OK."
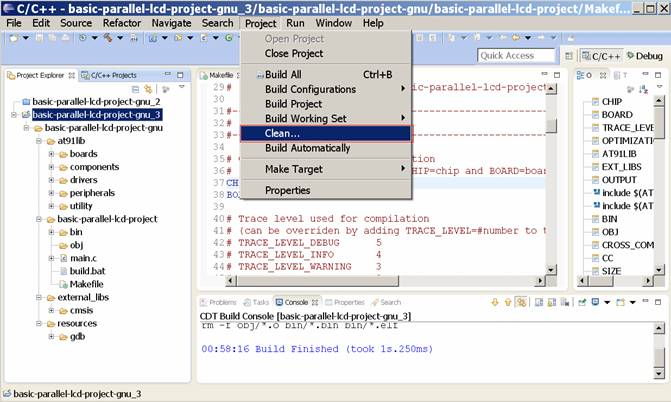
5.4. Clean the ProjectWith the project highlighted in the left pane, go to Project>Clean to delete the object files and output files:
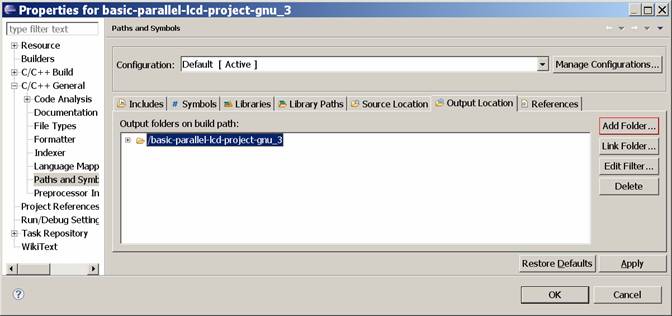
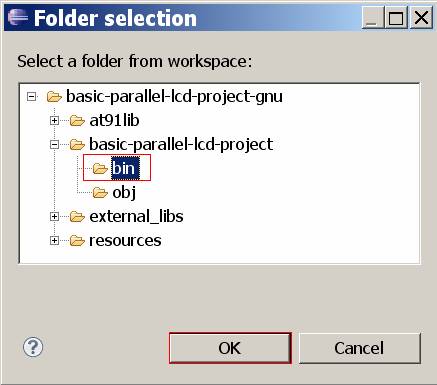
5.5. Set the Output Directory for the ProjectThe default Output Directory is the Project Root. If it is
located elsewhere, then go to
Navigate to the output folder, select it, and choose "OK."
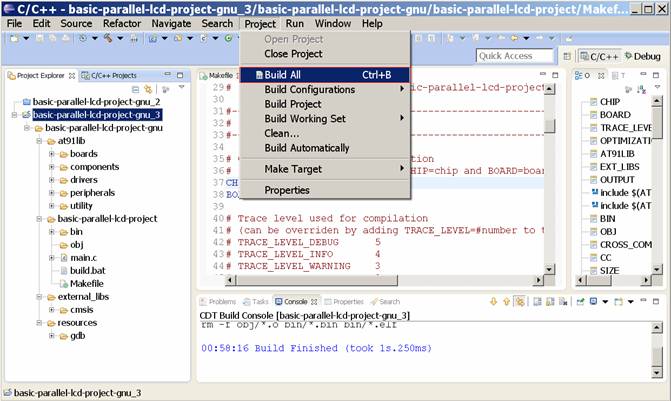
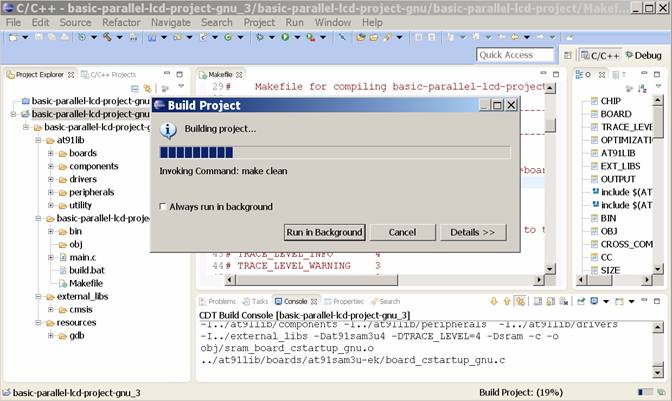
5.6. Build the ProjectWith the project highlighted in the left pane, go to Project>Build All to build the project:
The project will build according to your makefile:
6. Setting Up the Indexer
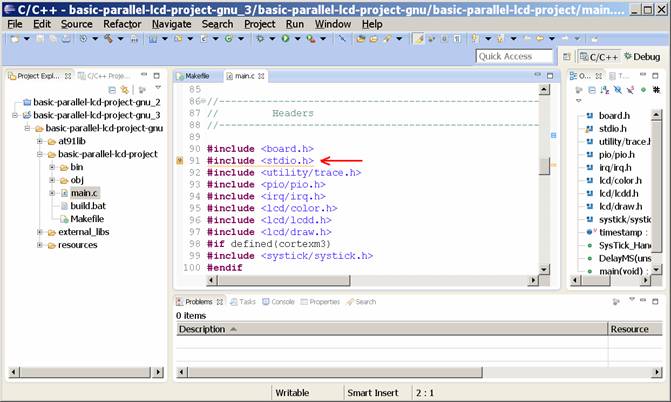
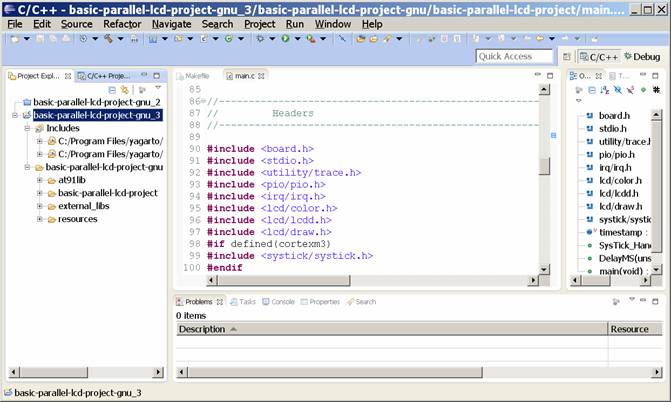
6.1. Setting Up Header File Include LocationsAfter the Index is rebuilt, Eclipse will show a warning that a header file inclusion is unresolved:
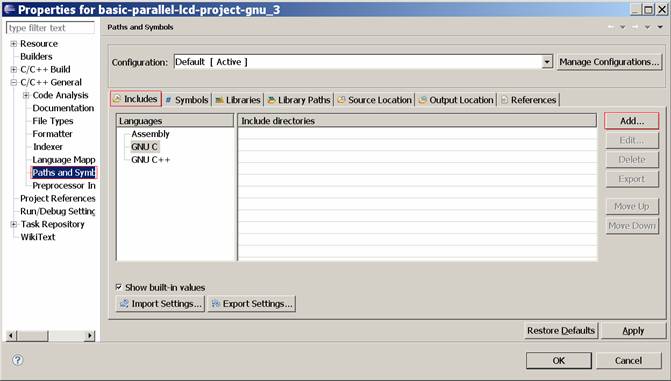
Go to Project>Properties>C/C++General>Paths & Symbols>Includes and choose "Add..."
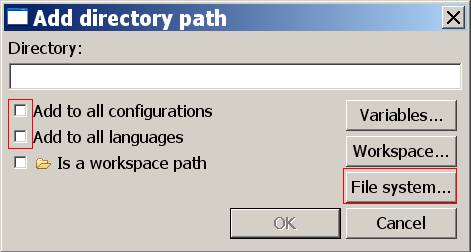
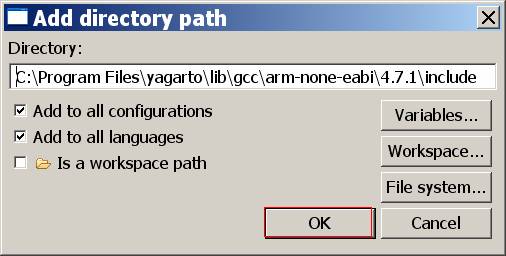
Navigate to the location of the compiler's Include file directory:
After rebuilding the index, the Header File Inclusion is now resolved:
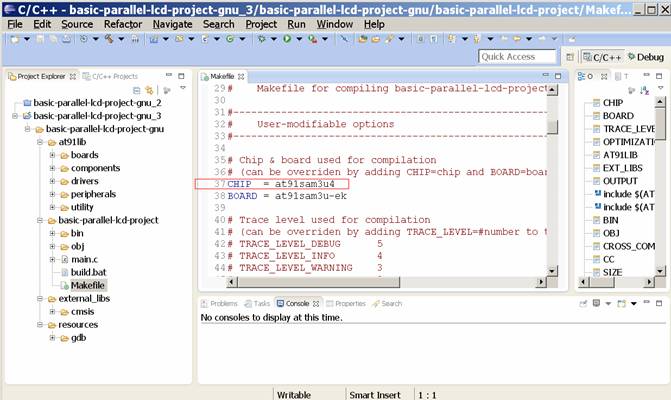
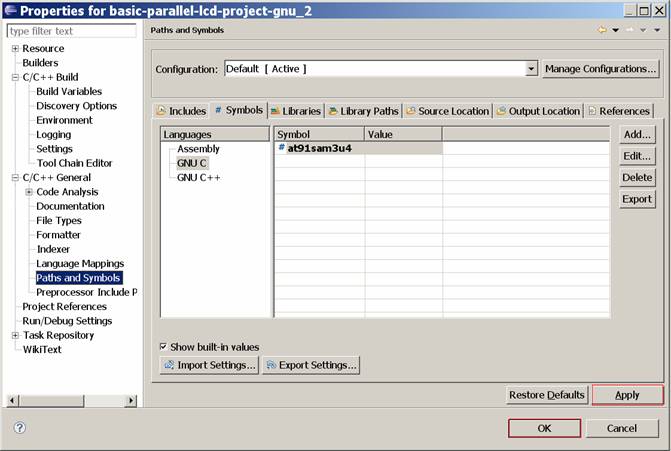
6.2. Add SymbolsSometimes there are symbols declared in places such as the MakeFile that need to be added to the indexer symbol list:
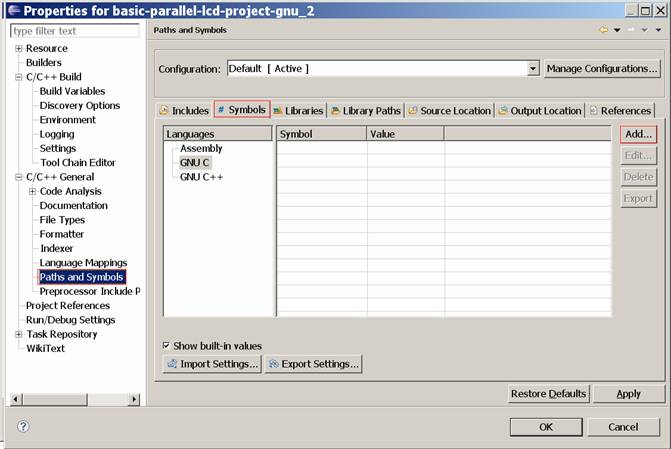
Go to Project>Properties>C/C++General>Paths & Symbols>Symbols and choose "Add..."
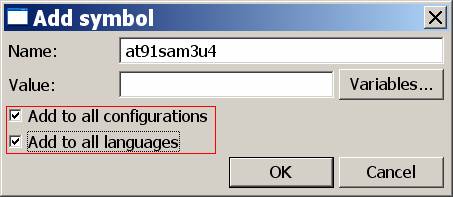
Add the symbol:
Choose "Apply" and then "OK."
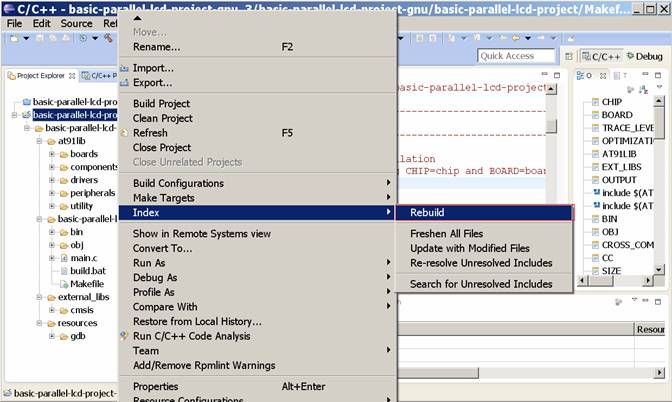
7. Using the Indexer7.1. Rebuild the IndexRight-Click menu on the highlighted project in the left pane and choose Index>Rebuild:
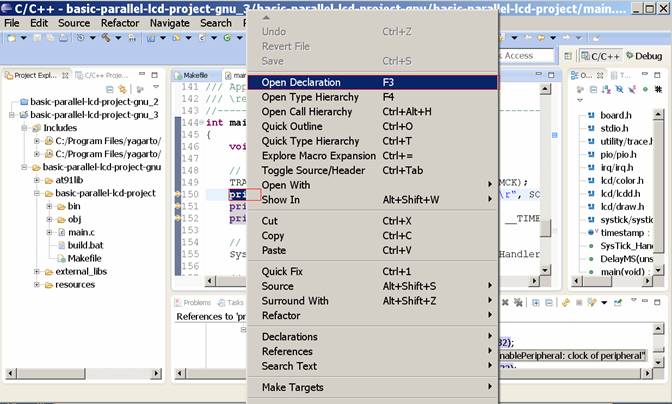
7.2. Search for Function or Variable DeclarationHighlight the function or variable in the code editor, right click and choose Open Declaration:
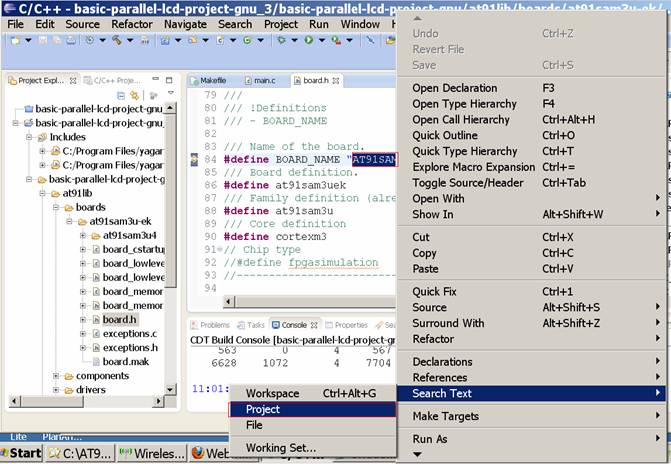
7.3. Search for Text in a File, Project, or WorkspaceHighlight the function or variable in the code editor, right click and choose Search Text>Project:
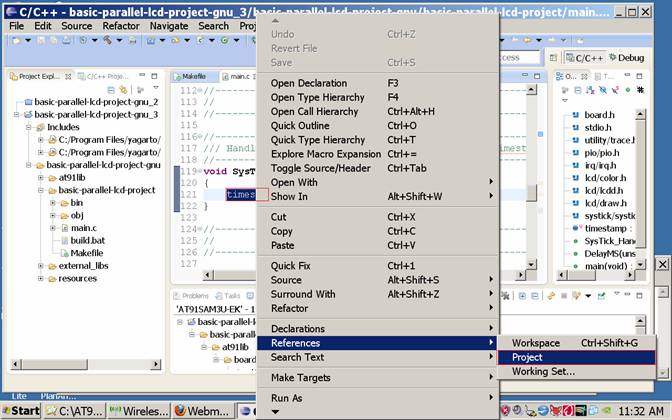
7.4. Search for References in a File, Project, or WorkspaceHighlight the function or variable in the code editor, right click and choose References>Project:
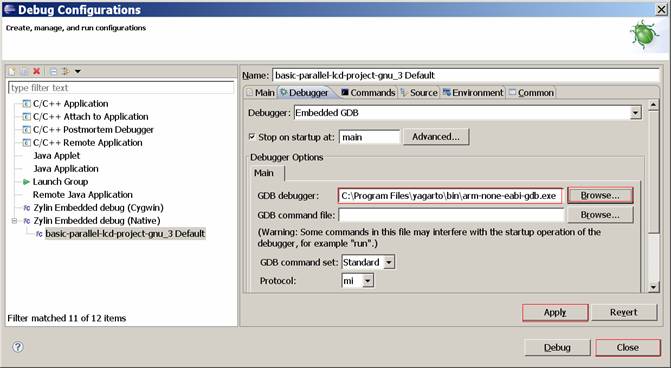
8. Using the Debugger in Eclipse8.1. Create a Debug Launch Configuration for the Project
The Launch Configuration locates the GDB debugger, locates the project's executable file, and provides a startup script of GDB commands to run as the debugger starts up.
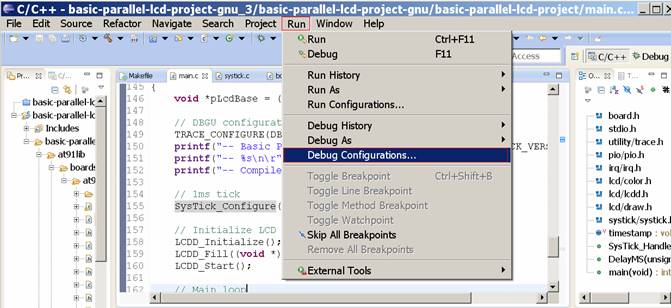
Choose Run>Debug Configurations...;
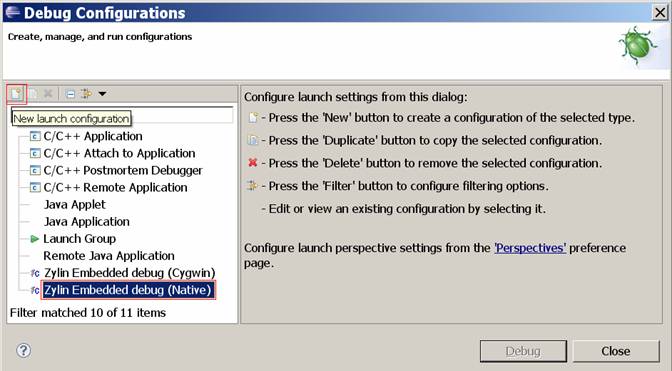
Highlight "Zylin Embedded Debug (Native)" then click the "New" icon:
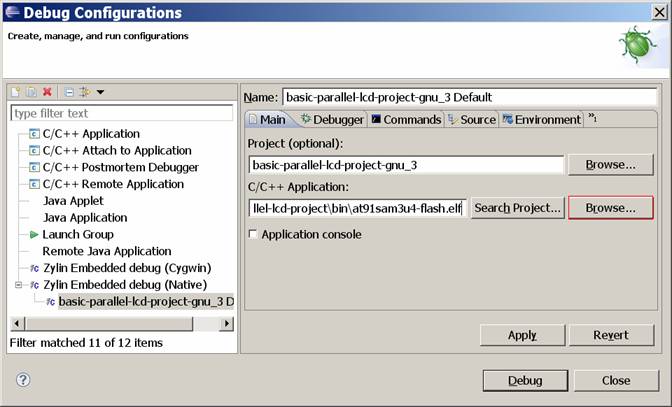
In the "Main" tab, navigate to the output file using the "Browse" button in the "C/C++ Application" section:
In the "Debugger" tab, navigate to the "GDB Debugger" file using the "Browse" button in the "GDB Debugger" section. In this case the path is: C:\Program Files\yagarto\bin\arm-none-eabi-gdb.exe
In the "Commands" tab, enter the information in Appendix A or Appendix B. The symbol file must be your output file used; in this case it is: "symbol-file at91sam3u4-flash.elf." When finished choose "Apply" then "Close."
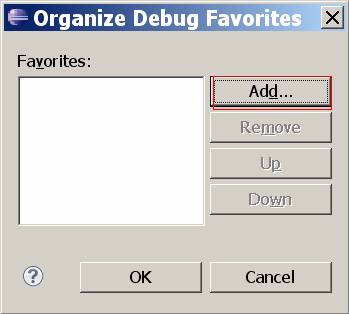
8.2. Adding Launch Configuration to the "Favorites" ListChoose "Organize Favorites..." from the Debug tool icon drop down menu;
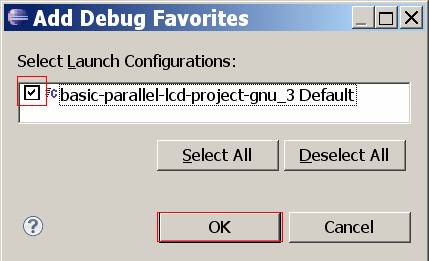
Choose "Add" in the next box:
Check the configuration just made, an select "OK."
The configuration now appears in the Debug tool icon drop down menu:
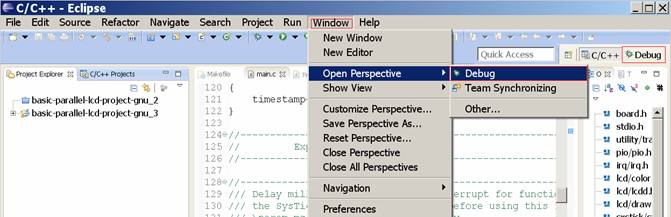
8.3. Open the Eclipse Debug PerspectiveChoose "Window>Open Perspective>Debug" or choose the "Debug" tab on the upper right.
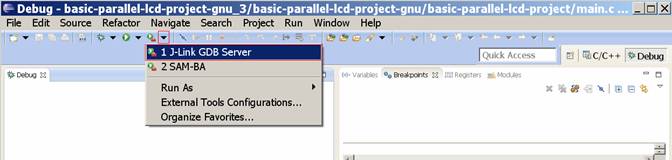
8.4. Start the J-Link GDB ServerChoose "Run>External Tools>J-Link GDB Server" or choose from the pull down on the tool icon bar:
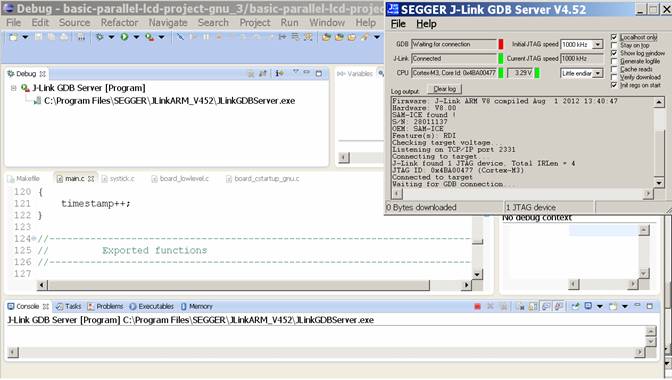
The J-Link server window will open, and the Eclipse debug window on the upper left will show the J-Link server running:
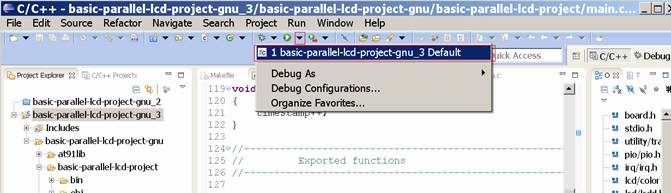
8.5. Start the Eclipse DebuggerChoose the Debug Configuration made earlier from the Debug tool icon drop down menu:
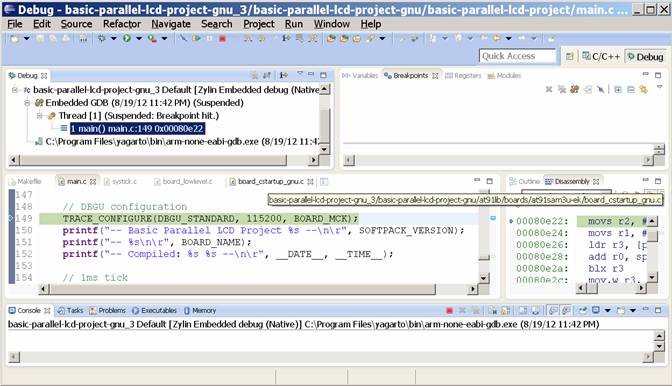
After a bit of time, the Debug session should be started:
9. Appendix9.1. Appendix A: James Lynch J-Link GDB Server Command Description for the AT91SAM7SIf you are using the J-Link GDB Server, enter the single GDB command "target remote localhost:2331" in the "Initialize commands" text window exactly as shown below. This command tells the GDB debugger to emit commands in RSP format to the TCP port "localhost:2331" (the port the J-Link GDB Server will be listening to).
target remote localhost:2331
To make entry of the "Run" commands more convenient, here is a list of them for "cut-and-paste" transfer to Eclipse.
Copy these commands into the "Run Commands" window:
monitor reset monitor speed 30 monitor speed auto monitor long 0xffffff60 0x00320100 monitor long 0xfffffd44 0xa0008000 monitor long 0xfffffc20 0xa0000601 monitor sleep 100 monitor long 0xfffffc2c 0x00480a0e monitor sleep 200 monitor long 0xfffffc30 0x7 monitor sleep 100 monitor long 0xfffffd08 0xa5000401 set remote memory-write-packet-size 1024 set remote memory-write-packet-size fixed set remote memory-read-packet-size 1024 set remote memory-read-packet-size fixed symbol-file main.out continue
The GDB startup commands for the J-Link GDB Server operation shown above require some explanation. If the command line starts with the word "monitor", then that command is a J-Link GDB Server command. Otherwise, it is a legacy GDB command. J-Link GDB Server commands are described in the document "JLinkGDBServer.pdf" which is in the Segger documentation folder that you downloaded ("c:\Program Files\SEGGER\JLinkARM_V368b\Doc\Manuals\") GDB commands are described in several books and in the official document that can be downloaded from: http://dsl.ee.unsw.edu.au/dsl-cdrom/gnutools/doc/gnu-debugger.pdf First, we have to halt the processor.
monitor reset # Reset the chip to get to a known state.
Next, we set up the JTAG speed
monitor speed 30 # Set JTAG speed to 30 kHz monitor speed auto # Set auto JTAG speed
Now we set up the processor's clocks, etc. using the register settings in the lowlevelinit.c function. These are J-Link GDB Server memory write commands used to set the various AT91SAM7S256 clock registers. This guarantees that the processor will be running at full speed when the "continue" command is asserted.
monitor long 0xffffff60 0x00320100 # set flash wait state (AT91C_MC_FMR) monitor long 0xfffffd44 0xa0008000 # watchdog disable (AT91C_WDTC_WDMR) monitor long 0xfffffc20 0xa0000601 # enable main oscillator (AT91C_PMC_MOR) monitor sleep 100 # wait 100 ms monitor long 0xfffffc2c 0x00480a0e # set PLL register (AT91C_PMC_PLLR) monitor sleep 200 # wait 200 ms monitor long 0xfffffc30 0x7 # set master clock to PLL (AT91C_PMC_MCKR) monitor sleep 100 # wait 100 ms
Enable the Reset button in the AT91SAM7S-EK board.
monitor long 0xfffffd08 0xa5000401 # enable user reset AT91C_RSTC_RMR
Now increase the GDB packet size to 1024. This will have a slight improvement on FLASH debugging as reads of large data structures, etc. may be speeded up. These are legacy GDB commands.
set remote memory-write-packet-size 1024 # Setup GDB for faster downloads set remote memory-write-packet-size fixed # Setup GDB for faster downloads set remote memory-read-packet-size 1024 # Setup GDB for faster downloads set remote memory-read-packet-size fixed # Setup GDB for faster downloads
Now we have to identify the file that has the symbol information. This is a legacy GDB command.
symbol-file main.out # read the symbol information from main.out
Finally we emit the legacy GDB command "continue". The processor is already halted at the Reset vector and will thus start executing until it hits the breakpoint set at main( ).
continue # resume execution from reset vector - will break at main( )
9.2. Appendix B: Atmel Doc6310 J-Link GDB Server Command Description
The last tab to examine is the "Commands" tab. (There is nothing to do in the "Source" and "Common" tabs as they are automatically set to correct values and are rarely modified.) There are several initialization and runtime commands to enter in order for the debugger to work correctly. Since the debugger will connect to the target remotely, this must be specified using this line: target remote localhost:2331 This command tells arm-elf-gdb to connect remotely to a server running on TCP/IP port 2331 on the local machine. This settings are the ones given by GDB Server (see Section 5.3.1 on page 20). When the command is executed, the connection status of the debugger should change in the GDB server window. This command must be put in the "Initialize" commands box. Once the debugger is connected, it is best to reset the target. This ensure that changes made during previous iterations of the debug process are discarded and will not affect a new session. This can be done by adding: monitor reset 1 Finally, since for debug configuration the program will run in SRAM, it must be uploaded to the target. This is done with the load command: load Both the reset and load commands should be put in the "Run" commands box.
Creating a Flash Configuration Debugging in Flash is almost the same as debugging in SRAM, except the program must be flashed prior to execution and is not reloaded when a debug session starts. To create a Flash debug configuration, do as described in section Section 5.3.2 on page 21 with two differences: 1) The binary file selected in the "Main" tab must be the one linked for Flash 2) The load command (in the "Commands" tab) must be omitted
Creating a SDRAM Configuration Several microcontrollers of the AT91 family can interface with an external SDRAM chip. This additional memory is useful for debugging programs since it is much larger than internal SRAM. However, conversely to SRAM, it is not possible to directly load code in the SDRAM, it must be initialized first. To do this, a GDB command file ("init_sdram.gdb") is provided with the Getting Started examples for chips which have an SDRAM controller. The script enables the main oscil-lator, PLL and SDRAM. The source command executes the specified GDB command file, therefore the SDRAM debug configuration is identical to the SRAM one except for two differences: 1) The binary file selected in the "Main" tab must be the one linked for SDRAM 2) In the "Commands" tab, the source init_sdram.gdb command must be added right before load (among the "Run" commands)
9.3. Appendix C: Include Library Locations for Yagarto
C:\Program Files\yagarto\lib\gcc\arm-none-eabi\4.7.1\include C:\Program Files\yagarto\arm-none-eabi\include
9.4. Appendix D: Symbol Definitions for the AT91SAM3U-EK MakeFile
at91sam3u4 at91sam3u-ek __GNUC__ cortexm3
9.5. Appendix E: Yagarto modifications for the AT91SAM3U-EK MakeFile
# Tool suffix when cross-compiling CROSS_COMPILE = arm-none-eabi- #CROSS_COMPILE = arm-elf-
Back to Top |
||